How to find the Mean, Median, and Mode

There are many ways you can show data. One of those ways is in a table, but if you want a more visual way to see data, graphing it is the way to go!
Making sense of the data
First of all, you should take a look at the data you've got

There are a couple of ways to make sense of it:
Mean
The mean is the average of all of the data. To calculate it, add up all of the numbers that you have, and then divide by how many numbers there are. For example, the mean of these numbers:
6, 19, 11
Is equal to 12 (6 + 19 + 11 = 36, 36/3 = 12)
Median
The median is the middle number in a list of numbers that is in order. To find it, sort all of the numbers you have and pick out the middle one. Here's an example:
14, 19, 22, 19, 13, 15, 11
First, let's put these numbers in order
11, 13, 14, 15, 19, 19, 22
Now, let's pick out the middle one
11, 13, 14, 15, 19, 19, 22
Now we know our median! 15!
Mode
The mode is which number appears the most. Let's take a look at an example:
15, 22, 11, 15, 36, 24, 24, 19, 15
Now, let's count how many times each number occurs
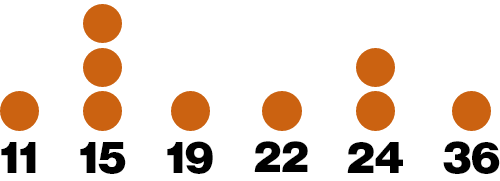
Looks like 15 is our mode!
Thanks for reading!